Save Upto 30 % in Your Compressed Air Costs By Implementing Systel’s Industry 5.0 Solutions
Why You Should Measure Your Compressed Air System?
Compressed Air Isn’t As Expensive As Its Mismanagement Can Make It To Be. In A Compressor’s Life Cycle Cost More Than 85 % Of The Costs Are Spent On Its Energy Whereas The Capital And Maintenance Costs Just Constitute To The Remaining 15%. Surprisingly During a New System Purchase the Focus Is Always on the Capital Costs With Only Theoretical Considerations of the Specific Energy Consumption. Specific Energy Consumption Is a Term Used To Define the Amount of Power a Compressor Consumes To Deliver an Output Unit of
Compressed Air. While Most of the End Users Measure the Compressor’s Power Consumption, the Compressors Output Flow Remains Unmeasured Leading to Factual Errors in Their Assumptions About Their Compressor’s Specific Energy Consumption. The Ambient Conditions Coupled With the Inefficiency and Tolerance Factors That Are Built Into a Compressor Can Take a Toll on its Energy Consumption and in Times May Increase the Specific Energy Consumption Even Upto 30 % of the Compressor’s Claimed Efficiency. Hence Consistent Monitoring of a Compressor’s Power Consumption and Discharge Flow Will Form a Key To Maintain the Supply Side Efficiency. Further a Well Designed System Should Define the Key Performance Indicators Like Flow, Power, Pressure, Dew Point and Should Be Measured at the Right Locations To Understand the Overall System Dynamics as Shown in Figure.
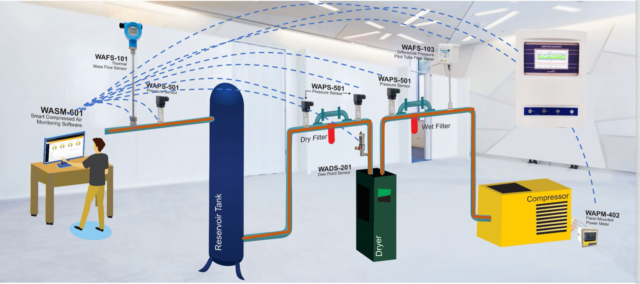
The Supply Side of the System When Improperly Aligned With the Demand Side Will Result in Over Compensation of System Pressures and Will Increase Artificial Demand and Related Problems Like,
• Higher Air Demand
• Higher Leak Rate
• Higher Repair Intervals and Costs
• Higher Energy Bills
• Higher Cost per Ton Produced
• Less Profits
Case Study :
A Speciality Steel Manufacturing Plant in India was operating 3 Nos of Centrifugal Compressors with Total Capacity of 14700 CFM. Each of these Centrifugal Compressors were installed with Orifice Plate Differential Pressure Flow Sensor for Measuring the Compressor Output delivery and the measured flow values were integrated to the Compressor’s Display Panel. The Compressors in total were consuming close to 75,000 kWH Per day. Refrigerant Compressors were Used for Drying the Air to a Dew Point of 3 0C.
On the Demand Side :
The Plant was Having 21 Departments which were major consumers of Compressed Air. Few of these departments were installed with Vortex Flow Sensors but were not measuring accurate flow. The Plant’s Instrumentation Team couldn’t remove these sensors for servicing or calibration since the Vortex flow sensors were of in-line type and for removing them they needed an complete plant shutdown. Further the Plant was also experiencing leakages to the level of 750 CFM. Though Frequent Leak Repair Programs were carried out, reoccurrence of leaks were a Consistent Problem. Pulverized Coal Injection (PCI) was a process requiring stable system pressure and due to the current pressure
drops, the Set Loading Pressures at all the 3 Compressors were configured at 1 bar more than the requirement of PCI Department.
Solution – Systel 4.0 Smart Monitoring System :
Step 1 : The Orifice Plate Flow Sensors were Causing Pressure Drops of Up to 0.2 Bar Across Each Measurement Points. The Energy Loss Across Each of these Orifice Plate Flow Sensors were up to 1104 kWH / day.


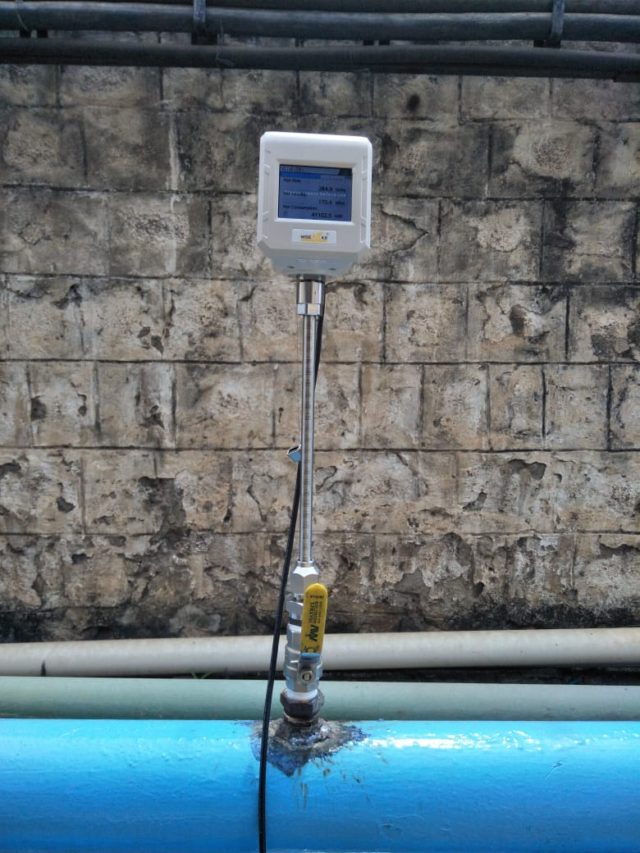
WAFS 103 – Insertion Type Pitot Tube Flow Sensors :
The 3 Nos of Orifice Plate Flow Sensors were replaced with Systel WAFS 103 Model Insertion Type Pitot Tube Flow Sensors. Since there is no Pressure Drop with Pitot Tube Flow Sensors the Plant was able to Save upto 1104 kWH Per day immediately on replacing the Orifice Plate Sensors with Pitot Tube Flow Sensors. The Return on Investment for installing the 3 Nos of Pitot Tube Flow Sensors was only 83 Days or Just Under 3 Months.
Step 2 : The Refrigerant Dryers were Displaying a Value of 3 – 7 0C which is the Temperature of the Evaporative Cooler and was not measuring the sample of the discharged Compressed Air. This Indication was wrongly interpreted by the Plant Personnel as Pressure Dew Point (PDP). On Measuring the Air at the Dryer discharge it was found that the Actual PDP was at 20 0C (17.5 g/m3 of Moisture).
The High Pressure Dew Point at the downstream of the dryer was the root cause of leakages in the plant as high moisture content in the system air was damaging the Oil seals of all the Pneumatic Equipment at the demand side. Also the high level of moisture content was causing rusting and scaling at the plant piping network inducing further pressure drops at various production headers.

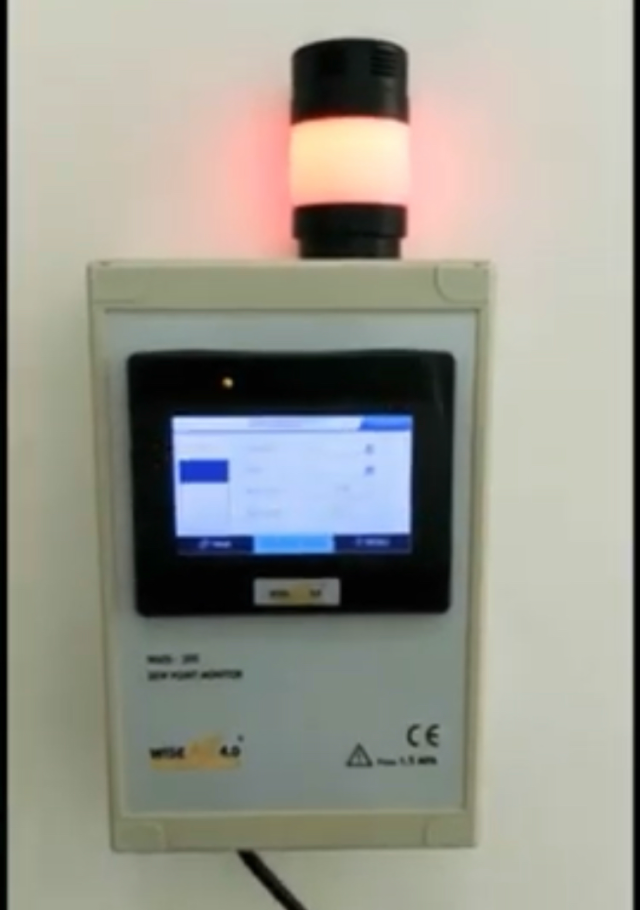
WADS 205 – Pressure Dew Point Sensors with Buzzer Alarm and Indicator Lights :
Systel 4.0’s WADS 205 PDP Sensors were installed and configured to alert the users whenever the PDP increases above 3 0C. On a thorough Inspection at the dryers it was found that the condensate removal was not effectively happening and it was rectified. Result, Air quality has improved significantly and the latest leak survey revealed that the reoccurrence of leaks has reduced by nearly 60%. The Factory now saves up to 500 CFM in reduced leakages and thereby saving up to 1718 kWH / day. The Return on Investment for installing the 3 Nos of WADS 205 Pressure Dew Point Sensors with Buzzer Alarm and Indicator Lights was only 27 Days or Just Under 1 Month.
Step 3 : The Vortex Flow Sensors installed at Each of the Production Headers were Causing Pressure Drops in the range of 0.1 to 0.2 Bar across each measuring locations. Whenever there was intermittent demand these pressure drops were aggravating the problem and causing fluctuating pressures at the PCI department. The Plant was forced to increase the Loading Set Points at the Compressor by upto 1 bar resulting in Energy Loss of Up to 1872 kWH / day. Since the Plant was having unregulated pressure usage at multiple production machines, the artificial demand was measured was at 736 CFM or equivalent to 3456 kWH Per Day.

WAFS 106 – Thermal Mass Flow Sensors :
All the 21 Vortex Flow Sensors were replaced with Systel 4.0 WAFS 106 Model of Thermal Mass Flow Sensors. Since these Insertion type Flow Sensors don’t induce pressure drop into the system the plant overcame its problem of pressure fluctuation and was able to successfully lower the Loading set Points at the compressors by 0.5 bar. Result, there has been a realized energy savings of up to 1862 kWH / day. PCI Department now works with stable pressure and without any pressure related problems. The Return on Investment for installing 21 Nos of WAFS 106 Smart Thermal Mass Flow Sensors was Just Under 9 Months.
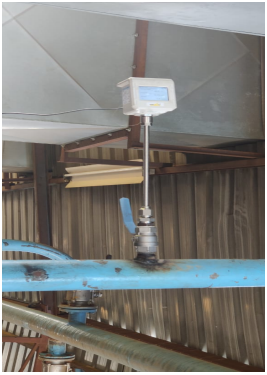
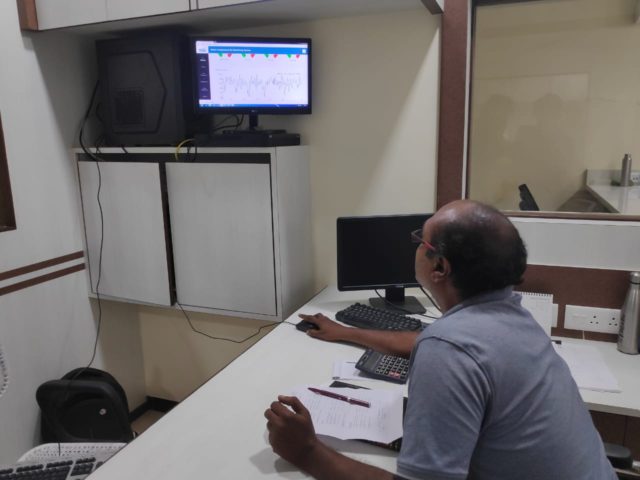
Step 4 : The Plant’s Complete Compressed Air System starting from the Generation till the End Uses were also digitalized with our Various Smart Sensors and integrated to our Artificial Intelligence Programmed Real Time Monitoring Software. The Software Collects All the data from Systel 4.0 Sensors and Self Analyses the same for any process deviations and immediately alerts the Users of any abnormalities.
Conclusion :
The Plant has invested Just Rs.75 Lacs for Systel’s Industry 5.0 Solutions and has Saved Over Rs.2.32 Crores in its Energy Cost. Return on Investment for this Project is Just Under 4 Months. Further The Plant Enjoys Stable System Pressure and Improved Air Quality. Maintenance and Repairs have also significantly reduced and the Plant’s Technical Team now have a full control over their Compressed Air System.
Regional Office
# 12 Sri Venkatalakshmi Nagar
Singanallur, Coimbatore – 641005
India
